Income Security
Income Security Summary
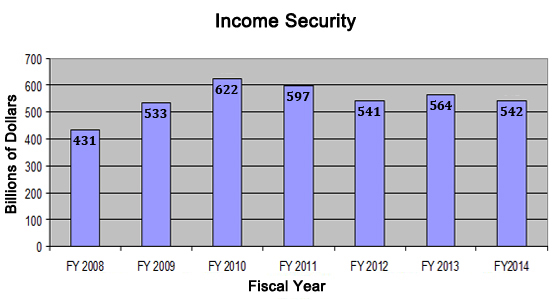
According to the Office of Management and Budget of the Executive Branch of the Federal Government, the expenditures for Income Security went from $431 billion in FY 2008 to $541 billion in FY 2012. By FY2013, these expenditures were $537 billion and constituted 16% of the Federal budget.

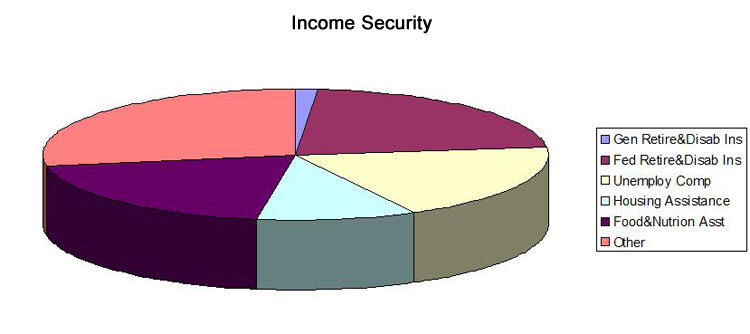
Income security expenditures are made up of the following programs:
General Retirement and Disability Insurance (excluding the Social Security Program) 1%, Federal Retirement and Disability Insurance 25%, Unemployment Compensation 13%, Housing Assistance 9%, Food and Nutrition Assistance 20%, and Other 32%.

As you can see in the chart below the big increases between FY 2008 and FY 2013 were in Federal Retirement and Disability Insurance, Unemployment Compensation, and Food and Nutrition Assistance.
| Program |
FY2008 |
FY2009 |
FY2010 |
FY2011 |
FY2012 |
FY2013 |
FY2014 |
| Gen Retire&Disab Ins |
8,899 |
8,218 |
6,564 |
6,697 |
7,760 |
8,001 |
7,282 |
| Fed Retire&Disab Ins |
108,998 |
118,119 |
119,867 |
124,450 |
122,388 |
133,567 |
140,878 |
| Unemploy Comp |
45,340 |
122,537 |
160,145 |
120,556 |
93,771 |
82,618 |
59,683 |
| Housing Assistance |
40,556 |
50,913 |
58,651 |
55,440 |
47,948 |
57,611 |
53,264 |
| Food&Nutrion Asst |
60,673 |
79,080 |
95,110 |
103,199 |
106,871 |
112,170 |
105,477 |
| Other |
166,847 |
154,357 |
181,873 |
187,010 |
162,606 |
170,027 |
175,232 |
|
431,313 |
533,224 |
622,210 |
597,352 |
541,344 |
563,994 |
541,816 |