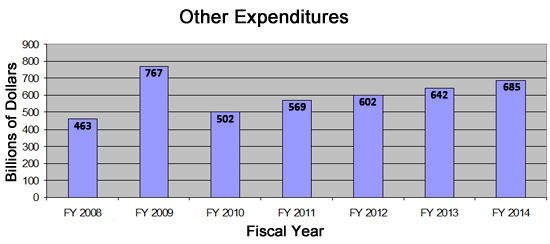
Other Expenditures
Other Expenditures Summary
According to the Office of Management and Budget of the Executive Branch of the Federal Government, the expenditures for the Other Expenditures category went from $474 billion in FY 2008 to $602 billion in FY 2012. By FY2013, these expenditures were $487 billion and constitute 14% of the Federal budget. By FY 2014, these expenditures are projected to be $580 billion, an increase of 16% in just 1 year.

As in any Other Expenditure category of a budget, Other Expenditures are a catch all and include many smaller items within the budget as well as misc inflows of funds. The different areas are noted below. For FY 2013, Transportation is 19% of the total category, Education, Training, Employment, and Social Services 15%, Health 19%, and Veterans Benefits and Services 29%.
| In billions: | FY 2008 | FY 2009 | FY 2010 | FY 2011 | FY 2012 | FY 2013 | FY 2014 |
| International Affairs: |
29 |
38 |
45 |
46 |
47 |
57 |
56 |
| Science, Space, and Technology: |
27 |
28 |
30 |
29 |
29 |
31 |
30 |
| Energy: |
1 |
5 |
12 |
12 |
15 |
15 |
13 |
| Natural Resources & Environment: |
32 |
36 |
44 |
45 |
42 |
38 |
40 |
| Agriculture: |
18 |
22 |
21 |
21 |
18 |
27 |
23 |
| Commerce & Housing Credit: |
28 |
292 |
-82 |
-13 |
41 |
18 |
-30 |
| Transportation: |
77 |
84 |
92 |
93 |
93 |
94 |
104 |
| Community & Regional Develop |
24 |
28 |
24 |
24 |
25 |
38 |
35 |
| Ed, Training, Employment, and Social Services: |
91 |
80 |
128 |
101 |
91 |
85 |
129 |
| Health: |
69 |
77 |
86 |
89 |
96 |
105 |
139 |
| Veterans Benefits & Services |
85 |
95 |
108 |
127 |
125 |
140 |
148 |
| Administration of Justice: |
48 |
53 |
54 |
56 |
56 |
61 |
59 |
| General Government: |
20 |
22 |
23 |
26 |
28 |
30 |
29 |
| Other |
-86 |
-93 |
-83 |
-87 |
-104 |
-97 |
-90 |
| Total |
463 |
767 |
502 |
569 |
602 |
642 |
685 |
The listing below shows the actual expenditures for FY2013 versus the FY 2008 expenditures. The table also shows the increase since FY2008 and the percentage increase of each category. The big dollar increases were in Veterans Benefits and Services by $54 billion, International Affairs by $17 billion, and Agriculture by $11 billion. Commerce and Housing Credits decreased by $111 billion (due to repayments from Fannie Mae and Freddie Mac), Education, Training, Employment, and Social Services by $18 billion and Other by $8 billion.