Taxes
Tax Summary
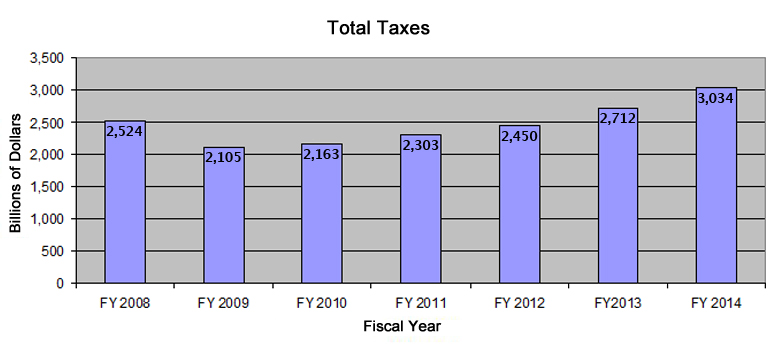
As you can see from the table and graph below, taxes have fully recovered and exceeded the FY2008 levels by FY2013. They fell by 17% or $419 billion in FY2009. Subsequently, taxes have recovered to $2,775 billion by FY2013. This is 10% higher than those taxes collected in FY 2008. Taxes are estimated to grow another 8% in FY2014.
| FY 2008 | FY 2009 | FY 2010 | FY 2011 | FY 2012 | FY 2013 | FY 2014 | |
| US Federal Budget | In billions | In billions | In billions | In billions | In billions | In billions | in billions |
| Taxes: | |||||||
| Individual Income Taxes |
1,146 |
915 |
899 |
1,091 |
1,132 |
1,234 |
1,383 |
| Corporate Income Taxes |
304 |
138 |
191 |
181 |
242 |
288 |
333 |
| Social Insuran&Retirement |
900 |
891 |
865 |
819 |
845 |
951 |
1,031 |
| Excise Taxes |
67 |
63 |
67 |
72 |
79 |
85 |
105 |
| Other |
107 |
98 |
141 |
140 |
152 |
154 |
182 |
| Total |
2,524 |
2,105 |
2,163 |
2,303 |
2,450 |
2,712 |
3,034 |

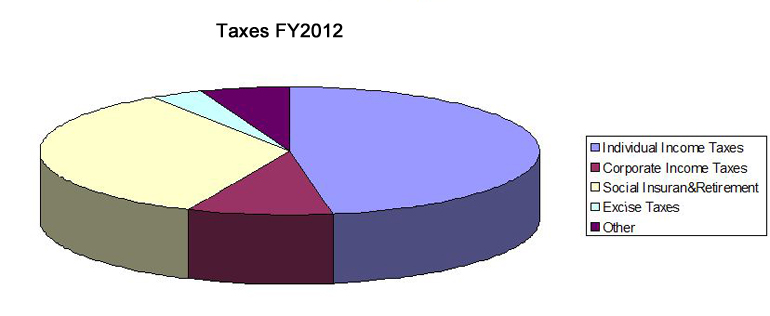
The distribution of taxes in FY2013 is shown in the pie chart below. Individual Income Taxes made up 47% of all taxes, social security insurance and retirement taxes 34%, Corporate Income Taxes 10%, Excise Taxes 3%, and other taxes 6%. In essence, the Federal Government is highly dependent on the first 2 taxes above which generate 81% of all it receipts.

The fall off of taxes between FY2008 and FY2009 caused by the second great contraction is detailed below. Individual income taxes decreased $231 billion or 20% and made up 55% of the overall decrease in taxes. Corporate income taxes decreased $166 billion or 55% and made up 40% of the overall decrease in taxes. The other changes were not material.
| FY 2008 | FY 2009 | Difference | Difference | Per Cent | |
| US Federal Budget | In billions | In billions | In billions | Per Cent | of Loss |
| Income: | |||||
| Individual Income Taxes |
1,146 |
915 |
-231 |
-20.16% |
55.13% |
| Corporate Income Taxes |
304 |
138 |
-166 |
-54.61% |
39.62% |
| Social Insurance and Retirement Receipts |
900 |
891 |
-9 |
-1.00% |
2.15% |
| Excise Taxes |
67 |
63 |
-4 |
-5.97% |
0.95% |
| Other |
107 |
98 |
-9 |
-8.41% |
2.15% |
| Total |
2,524 |
2,105 |
-419 |
-16.60% |
100.00% |
The source of these figures was from The Office of Management and Budget website, the historical figures page. The FY2013 figures from OMB are now finalized and the figures for FY2014 are estimated and will not be finalized for some time.